By Dr. A. Elizabeth Sloan & Dr. Catherine Adams Hutt, Sloan Trends, Inc.07.02.18
The massive clean label movement continues to go mainstream as clean label products outpace their traditional counterparts in a wide variety of nutraceutical categories beyond food and beverage, including personal and beauty care, dietary supplements, pet products, and over-the-counter remedies.
Going Global
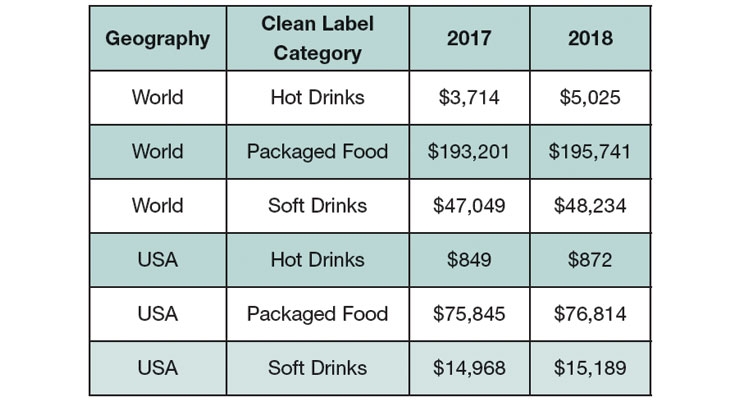
Global sales of clean label packaged foods reached $193.2 billion in 2017; soft drinks $47 billion, according to Euromonitor (Figure 1). Organic food/drinks led global retail value sales growth with a compounded annual growth rate of 7% from 2012-2017, followed by “free-from” products, up 6%. Just over half of global consumers agree that eliminating undesirable ingredients is more important than adding beneficial ones; 70% in Asia-Pacific per Nielsen’s 2016 Global Ingredient Report.
In the U.S., sales of clean label packaged foods reached $75.8 billion; soft drinks $14.9 billion, per Euromonitor. Organic food/drink sales reached an all-time high in 2017 of $45.2 billion, up 6.4% vs. 2016. Beverages now rank third after produce and dairy as the largest organic categories, per the Organic Trade Association.
One-third of all U.S. grocery products are now clean label, 25% of dairy. Half of all grocery shopping trips include a clean label food/drink, according to Nielsen’s September 2017 Clean Label Report.
U.S. adults who prefer to eat foods free from artificial additives reached an all-time high last year; 70% bought at least one natural food product per month, 60% organic, and 55% without artificial additives. One-third shop in a natural food store, according to Packaged Facts’ January 2018 Organic and Clean Label Consumer report.
One in three consumers buy mainly natural/organic when food shopping. Just under half (46%) seek out non-GMO foods/beverages, 72% of natural/organic consumers, according to Packaged Facts.
While there is no regulatory or agreed upon consumer definition of the term “clean,” according to the Hartman Group’s 2017 Health + Wellness report, uncontaminated and transparent are at the core of what clean means today.
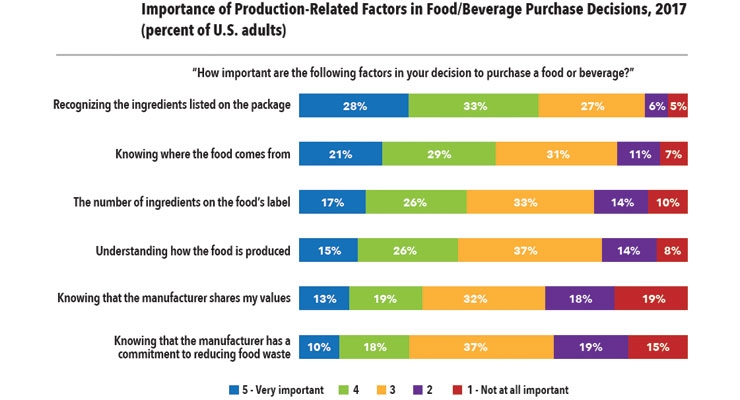
Recognizable ingredients, where the food comes from, and the number of ingredients are the top factors impacting food purchases, according to Packaged Facts (Figure 2).
Moreover, as interest in clean label grows, savvy consumers are looking for other attributes to verify a product’s clean status, especially botanicals and superfoods, per Nielsen.
Perhaps most startling, Nielsen reported that only 40% of U.S. diet/nutrition foods/beverages were clean labeled in 2017. This is a missed opportunity.
Clean Foods: Gen 2
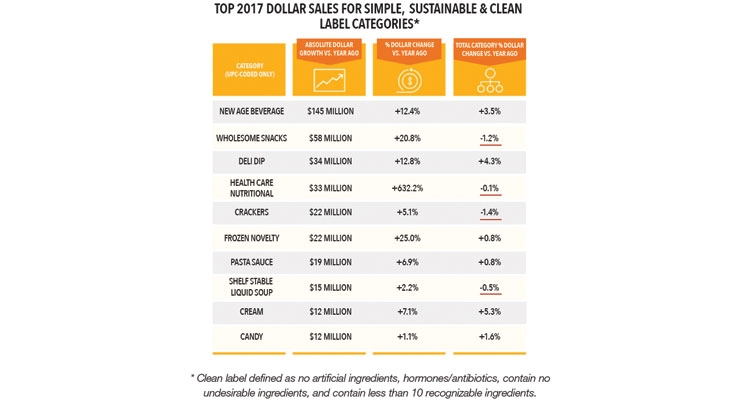
New age beverages posted the highest dollar gains for clean label foods for the year ending Dec. 9, 2017, up $145 million or 12.4%; followed by wholesome snacks at $58 million, up 20.8%; deli dips $34 million, up 12.8%; and healthcare nutritionals $33 million, up a whopping 632.2% (Figure 3). Clean label salty snacks, frozen foods, cookies, and candy are also outpacing traditional product sales.
Ninety-percent of the milk/dairy alternatives category is now clean label, 83% of sugar/sweeteners, 57% baking supplies, and 42% of fully cooked meats. Sales of foods that contain non-caloric sweeteners and are free from artificial sweeteners grew 16% in dollar sales in 2017, per Nielsen’s What’s Next for Health & Wellness 2018.
Fresh foods, which account for 40% of all clean label dollars spent, are another missed opportunity. Nielsen reported that only 24% of fresh meat was clean labeled for the year ending Jul. 9, 2017, 19% of salad dressings, 12% of pizza, 8% of sweet goods, and 5% of lunch meat. Sales of fresh clean label cookies jumped 31%; clean deli soups 18%.
Clean label ranks second only to natural as the highest-demand beverage attribute for 2018, according to Beverage Industry’s January 2018 New Product Development Outlook for Beverages.
With only 24% of larger companies vs. 40% of smaller business embracing cleaner labels, targeting larger players is a big idea. Sales of clean label foods/drinks from large companies with more than $1 billion in revenue grew 5% for the year ending Apr. 27, 2017 vs. 9% for smaller businesses.
Clean label consumers are most likely to be millennials/gen Xers or from higher income/education households, have children at home, live in urban areas, or in the Northeast/West, per Packaged Facts.
Clean label consumers are far more likely to be foodies, snackers, weight managers, watching their diet for health reasons, organic food users, ethnic food eaters, pet owners, or Asian/Hispanic, Packaged Facts reported.
Those who eat vegetarian or vegan are also highly likely to be clean label seekers. With dollar sales of frozen/prepared plant-based food sales up 20.7% in 2017; fully cooked faux meats up 18.9%; and plant-based diet/nutrition products up 14.1%, per Nielsen, finding effective plant-based preservation systems is a must-do task.
Monosodium glutamate, sulfites, phosphate, gelatin, carrageenan, and casein are among the ingredients consumers are also concerned about on labels, according to Mintel’s 2017 Clean Label 2.0.
Crossover Categories
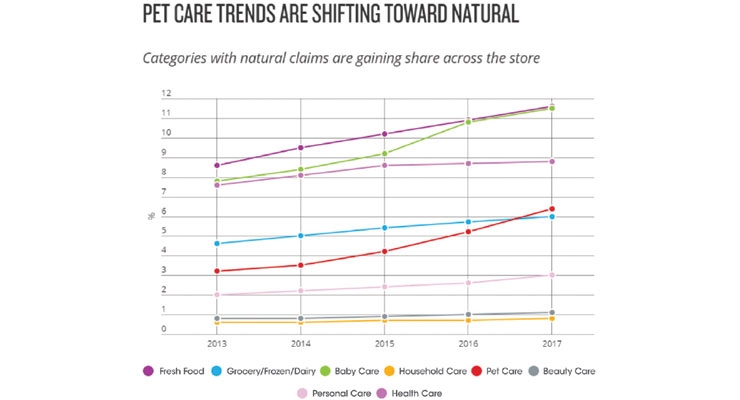
Half (51%) of U.S. households view natural as important for all products beyond the food/drink aisles, as natural claims gain share across the store.
Over half (57%) of pet owners buy pet foods with natural ingredients, 33% without GMOs, and 31% that are organic, per Packaged Facts 2018 Pet Owner Survey. Nielsen reported sales of all-natural pet foods jumped 8% in 2017. Pet food sales reached $29.9 billion in 2017; 68% of U.S. households have at least one pet, per the American Pet Products Association’s 2018 National Pet Owners Survey (Figure 4).
Sales of organic dietary supplements grew 25% for the year ending Apr. 15, 2017, per Nielsen; those with a natural claim rose 11%. Organic is an important factor in purchasing supplements for 15% of users; country-of-origin for 23%, according to CRN’s 2017 Annual Survey on Dietary Supplements.
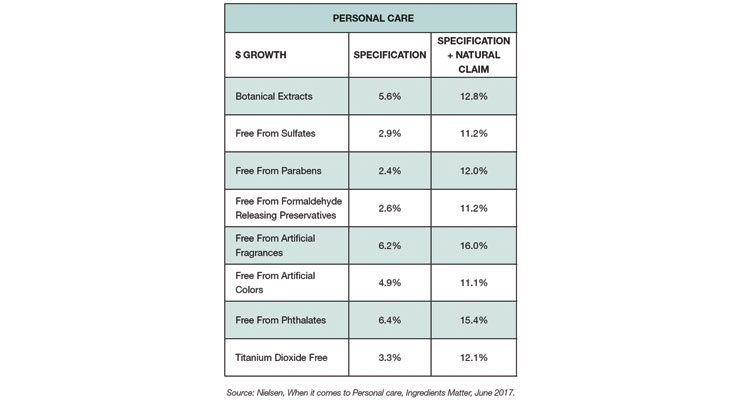
While natural personal products continue to enjoy strong growth at 9% in 2017, products that carried a natural claim along with a claim of “free-from” undesirable ingredients (e.g., parabens), or a claim of containing naturally-derived botanical ingredients enjoyed double-digit sales growth (Figure 5). Sales of personal products with superfood ingredients (e.g., strawberry, legumes, or coconut oil) jumped 107%, 28%, and 24%, respectively.
Similarly, although natural beauty products are still enjoyingrobust growth of 8%, sales growth is down from 16% in 2015 as consumers opt for products that deliver not only cleaner, simpler ingredients but functional beauty benefits as well, per Nielsen.
Just over one third of global consumers want their laundry detergent as well as their all-purpose household cleaners to be free of “harsh chemicals,” those in Asia-Pacific, Africa/Middle East and Western Europe are most likely to agree.
Perhaps most exciting is the advent of “natural OTCs,” which combine natural, botanical, and other specialty ingredients to deliver a desired OTC-like pharmaceutical affect. While the regulatory status is somewhat unclear, Klein’s 2016 Natural OTCs reported that 40% of U.S. consumers were more satisfied with natural OTCs vs. traditional products. One-third view them as more effective; 34% equally effective. Half of adults believe they’re safer; 49% would give a natural OTC to their child.
Nine out of the top 10 selling sleep aids are now natural OTCs. Proctor & Gamble recently added a natural ZZZQuil Pure ZZZs formula to its line. SPINS reported sales of homeopathic remedies reached $1.9 billion in 2017.
Looking Ahead
The best-selling new U.S. non-food consumer product launches in 2017 attest to the immense power of clean, natural, and botanical product combinations. Garnier Whole Blends (castor oil/maple extract and olive oil/leaf hair care products) ranked #1, with $121.8 million in year-one sales, per IRI’s 2018 New Product Pacesetter Report. BioFreeze external rubs, using menthol as the anti-pain agent, ranked #2 with sales of $78 million; Herbal Essences’ Bio Renew shampoo ranked #3 with $75 million; and Maui Moisture hair care products #9 with coconut milk, agave, shea butter, and sea minerals, posting sales of $40.2 million.
Dr. A. Elizabeth Sloan & Dr. Catherine Adams Hutt
Sloan Trends, Inc.
Dr. A. Elizabeth Sloan and Dr. Catherine Adams Hutt are president and chief scientific and regulatory officer, respectively, of Sloan Trends, Inc., Escondido, CA, a 20-year-old consulting firm that offers trend interpretation/predictions; identifies emerging high potential opportunities; and provides strategic counsel on issues and regulatory claims guidance for food/beverage, supplement and pharmaceutical marketers. For more information: E-mail: lizsloan@sloantrend.com; Website: www.sloantrend.com.

