Simone Baroke, Contributing Analyst, Euromonitor International04.20.16
In March 2016, Public Health England published the Eatwell Guide, which replaces the Eatwell Plate. We take a look at the official new healthy eating advice, highlighting how it differs from its predecessor in some crucial points and how the new guidelines correspond to actual U.K. eating trends by consulting our packaged food, beverages and fresh food data.
Snack & Confectionery Products Move Off the Plate
The most striking revision made by the new Eatwell Guide is that indulgence products like ice cream, cakes, biscuits, confectionery and sweet and savory snack products have moved off the (stylized) plate. They have been relegated to the sidelines—the bottom left corner of the graphic, to be precise—as a kind of extraneous matter, with the words "eat less often and in small amounts."
The old Eatwell Plate, by comparison, still featured these "foods and drinks high in fat and/or sugar" as a firm component, taking up 7% of actual plate space. This inclusion had always been controversial, particularly since the text directly above the pictorial representation of the Eatwell Plate read: "For a diet to be healthy, it needs to be balanced. This page shows you the proportions of the different types of food you should try to eat."
The Eatwell Guide no longer implies that people should eat indulgence foods high in fat and sugar in order to achieve a balanced diet. Furthermore, the new guidelines explicitly state that these products "are not needed in the diet," advises consumers to check labels and to "avoid foods which are high in fat, salt and sugar." (This also applies to soft drinks, which we shall examine in more detail shortly.)
But are U.K. consumers actually cutting down on indulgence products? Well, not quite, but our packaged food data from Euromonitor demonstrate that per capita volume sales of the aforementioned indulgence product categories are fairly stagnant overall, rather than showing an upward trend, which may be mildly encouraging for the Eatwell Guide authors. To illustrate: while per capita total volume sales (foodservice and retail combined) of a handful of categories rose slightly, like biscuits and ice cream (the latter increasing from 7.6 liters in 2010 to 8.2 liters in 2015), other categories, such as crisps, cakes and sugar confectionery, posted a mild contraction.
Fat: Tricky Terrain
The war on saturated fat continues. To this end, the Eatwell Guide has removed butter from the central plate graphic and lumped it into the naughty corner with cakes and confectionery. The new oil & spreads section, which did not exist as a separate segment on the old Eatwell Plate, and where one might expect butter to be found, focuses entirely on unsaturated oils.
Our packaged food data show that rapeseed oil, in particular, benefits from the health and wellness trend on account of its extraordinarily high content of polyunsaturated fats. Higher in fact than olive oil while, at the same time, being much cheaper. Per capita total volume sales of rapeseed oil rose from 0.1 liters per capita in 2010 to 0.4 liters in 2015, while olive oil volumes remained static at 0.7 liters per capita.
When it comes to butter, though, a gulf is opening up between consumer perceptions and the opinions of public health professionals. In a nutshell, the latter deems butter, which consists overwhelming of saturated fat, as promoting heart disease, while consumers have come to regard butter as "natural." And since natural has become synonymous with "healthy" in public perception, per capita butter intakes are gradually rising while those of margarine (high in unsaturated fats) are falling.
Sugary Drinks Eliminated, Limit Put On Juice
Another notable difference between the U.K. governments' previous and the new healthy eating advice is that sugary drinks, which used to mingle on the plate with sweet and savory snacks and confectionery, have been removed altogether.
The recommendations now state that people should aim to consume 6-8 glasses of fluid a day in the form of water, lower fat milk, sugar-free drinks including tea and coffee, and that the consumption of fruit juice and smoothies should be limited to 150 ml a day on account of being a source of free sugars.
Our soft drinks data show that per capita volume sales of carbonates dropped by 3% over the 2010-2015 review period, while that of bottled water shot up by 30%.
However, with tap water culture still leading in the U.K. it comes with less of a surprise that sales of bottled water were at 39.9 liters per capita in 2015, which is still only half that of carbonates.
The data also show that U.K. juice consumption is actually falling. Total per capita sales (off-trade and on-trade combined) dropped from 35.9 liters in 2010 to 30.0 liters in 2015. And it is 100% fruit juice that has seen the strongest decline compared to juice drinks, and nectars, where the drop in per capita sales was merely marginal.
The much-publicized fact that the amount of sugar in a glass of 100% fruit juice was equal to that found in a can of cola, has clearly hit home with U.K. consumers. They still appreciate the nutritional benefits that juice has to offer, such as a high content of vitamins, minerals and antioxidants, but many have come to view it more as a healthy treat or even as a kind of "nutritional supplement" rather than a thirst-quenching beverage. It should be noted that the Eatwell Guide still allows for fruit juice to be counted as one of the recommended 5-A-Day servings of fruits and vegetables.
More Emphasis On Plant-Based Protein Sources
For the first time, official U.K. healthy eating guidelines do not solely focus on the nutritional health of the consumer, but also on the health of the planet. Helping consumers to "get a balance of healthier and more sustainable food" is the Eatwell Guide's mission.
To this end, there is an ostensible shift in emphasis away from animal proteins toward plant-based choices, since the latter tend to have a much smaller environmental footprint.
The Eatwell Guide's protein food segments, as depicted on its central graphic, reflect this accordingly. The dairy slice has shrunk from occupying 15% on the old Eatwell Plate down to 8% in the Eatwell Guide, and is no longer designated "Milk and dairy foods," but "Dairy and alternatives," with a carton labeled "soya milk" clearly visible right next to a milk container. And indeed, dairy alternatives show rampant growth in the U.K.; in 2015, other non-dairy milk alternatives again delivered the highest total volume growth (13%) of any dairy category, continuing its growth-leading streak for the fourth year running.
Meanwhile, the former Eatwell Plate slice labeled "meat, fish, eggs, beans and other non-dairy-based proteins" has morphed into "Beans, pulses, fish, eggs, meat and other proteins," putting plant-based protein sources first and shuffling meat toward the end. The guidelines advise consumers to eat less red and processed meat.
Our fresh food data show that per capita meat volumes (retail, foodservice and institutions combined) posted a decline from 35.1 kg in 2010 to 33.9 kg in 2015. However, fresh pulses also experienced a drop, rather than an increase. The main reason for this is that fresh pulses lack the all-important convenience factor.
Carbs Struggle
Overall, the creators of the Eatwell Guide did quite an admirable job at trying to take current U.K. eating trends into account while, at the same time, advocating a healthy diet. Of course, there will always be sticking points, like in the case of butter, where public perception runs counter to nutrition science.
Carbohydrates are another one of these issues. The Eatwell Guide's advice to "base meals around starchy carbohydrate foods" is a message that is falling out of favor with consumers, because carbs have come to be regarded as "fattening." According to our packaged food data, sales of all the principal carbohydrate sources cited on the stylized plate graphic, namely potatoes, bread, rice and pasta, are struggling in the U.K.
Total fresh potato volumes, for instance, plummeted from 40.3 kg per capita in 2010 to 34.0 kg in 2015, and those of bread fell from 41.4 kg to 35.5 kg in the same period. Rice, pasta and noodles managed to cling on, posting a marginal increase 0.3 kg per capita increase since 2010—nowhere near enough to compensate for the losses experienced by the other staple carbohydrate categories. Unfortunately, it isn't fresh produce that is benefiting from this; our fresh food data show that per capita volume sales of fresh fruits and vegetables fell by 4% during 2010-2015.
Today's consumers are instead looking for protein-rich foods to compensate for maligned carbs. Fresh eggs managed to take advantage of this trend, gaining 13% in per capita volumes over the review period. Fresh pulses, however, didn't, as already pointed out, with per capita volumes declining by 5% over the review period. It seems that consumers are more drawn to processed, packaged, high-protein options, such as snack foods made from pulses and, increasingly, dried meat which is, after all, what one would expect in a heavily convenience-oriented market like the U.K.
For further insight contact Ewa Hudson, Global Head of Health and Wellness Research at Euromonitor International, at ewa.hudson@euromonitor.com; http://blog.euromonitor.com
Snack & Confectionery Products Move Off the Plate
The most striking revision made by the new Eatwell Guide is that indulgence products like ice cream, cakes, biscuits, confectionery and sweet and savory snack products have moved off the (stylized) plate. They have been relegated to the sidelines—the bottom left corner of the graphic, to be precise—as a kind of extraneous matter, with the words "eat less often and in small amounts."
The old Eatwell Plate, by comparison, still featured these "foods and drinks high in fat and/or sugar" as a firm component, taking up 7% of actual plate space. This inclusion had always been controversial, particularly since the text directly above the pictorial representation of the Eatwell Plate read: "For a diet to be healthy, it needs to be balanced. This page shows you the proportions of the different types of food you should try to eat."
The Eatwell Guide no longer implies that people should eat indulgence foods high in fat and sugar in order to achieve a balanced diet. Furthermore, the new guidelines explicitly state that these products "are not needed in the diet," advises consumers to check labels and to "avoid foods which are high in fat, salt and sugar." (This also applies to soft drinks, which we shall examine in more detail shortly.)
But are U.K. consumers actually cutting down on indulgence products? Well, not quite, but our packaged food data from Euromonitor demonstrate that per capita volume sales of the aforementioned indulgence product categories are fairly stagnant overall, rather than showing an upward trend, which may be mildly encouraging for the Eatwell Guide authors. To illustrate: while per capita total volume sales (foodservice and retail combined) of a handful of categories rose slightly, like biscuits and ice cream (the latter increasing from 7.6 liters in 2010 to 8.2 liters in 2015), other categories, such as crisps, cakes and sugar confectionery, posted a mild contraction.
Fat: Tricky Terrain
The war on saturated fat continues. To this end, the Eatwell Guide has removed butter from the central plate graphic and lumped it into the naughty corner with cakes and confectionery. The new oil & spreads section, which did not exist as a separate segment on the old Eatwell Plate, and where one might expect butter to be found, focuses entirely on unsaturated oils.
Our packaged food data show that rapeseed oil, in particular, benefits from the health and wellness trend on account of its extraordinarily high content of polyunsaturated fats. Higher in fact than olive oil while, at the same time, being much cheaper. Per capita total volume sales of rapeseed oil rose from 0.1 liters per capita in 2010 to 0.4 liters in 2015, while olive oil volumes remained static at 0.7 liters per capita.
When it comes to butter, though, a gulf is opening up between consumer perceptions and the opinions of public health professionals. In a nutshell, the latter deems butter, which consists overwhelming of saturated fat, as promoting heart disease, while consumers have come to regard butter as "natural." And since natural has become synonymous with "healthy" in public perception, per capita butter intakes are gradually rising while those of margarine (high in unsaturated fats) are falling.
Sugary Drinks Eliminated, Limit Put On Juice
Another notable difference between the U.K. governments' previous and the new healthy eating advice is that sugary drinks, which used to mingle on the plate with sweet and savory snacks and confectionery, have been removed altogether.
The recommendations now state that people should aim to consume 6-8 glasses of fluid a day in the form of water, lower fat milk, sugar-free drinks including tea and coffee, and that the consumption of fruit juice and smoothies should be limited to 150 ml a day on account of being a source of free sugars.
Our soft drinks data show that per capita volume sales of carbonates dropped by 3% over the 2010-2015 review period, while that of bottled water shot up by 30%.
However, with tap water culture still leading in the U.K. it comes with less of a surprise that sales of bottled water were at 39.9 liters per capita in 2015, which is still only half that of carbonates.
The data also show that U.K. juice consumption is actually falling. Total per capita sales (off-trade and on-trade combined) dropped from 35.9 liters in 2010 to 30.0 liters in 2015. And it is 100% fruit juice that has seen the strongest decline compared to juice drinks, and nectars, where the drop in per capita sales was merely marginal.
The much-publicized fact that the amount of sugar in a glass of 100% fruit juice was equal to that found in a can of cola, has clearly hit home with U.K. consumers. They still appreciate the nutritional benefits that juice has to offer, such as a high content of vitamins, minerals and antioxidants, but many have come to view it more as a healthy treat or even as a kind of "nutritional supplement" rather than a thirst-quenching beverage. It should be noted that the Eatwell Guide still allows for fruit juice to be counted as one of the recommended 5-A-Day servings of fruits and vegetables.
More Emphasis On Plant-Based Protein Sources
For the first time, official U.K. healthy eating guidelines do not solely focus on the nutritional health of the consumer, but also on the health of the planet. Helping consumers to "get a balance of healthier and more sustainable food" is the Eatwell Guide's mission.
To this end, there is an ostensible shift in emphasis away from animal proteins toward plant-based choices, since the latter tend to have a much smaller environmental footprint.
The Eatwell Guide's protein food segments, as depicted on its central graphic, reflect this accordingly. The dairy slice has shrunk from occupying 15% on the old Eatwell Plate down to 8% in the Eatwell Guide, and is no longer designated "Milk and dairy foods," but "Dairy and alternatives," with a carton labeled "soya milk" clearly visible right next to a milk container. And indeed, dairy alternatives show rampant growth in the U.K.; in 2015, other non-dairy milk alternatives again delivered the highest total volume growth (13%) of any dairy category, continuing its growth-leading streak for the fourth year running.
Meanwhile, the former Eatwell Plate slice labeled "meat, fish, eggs, beans and other non-dairy-based proteins" has morphed into "Beans, pulses, fish, eggs, meat and other proteins," putting plant-based protein sources first and shuffling meat toward the end. The guidelines advise consumers to eat less red and processed meat.
Our fresh food data show that per capita meat volumes (retail, foodservice and institutions combined) posted a decline from 35.1 kg in 2010 to 33.9 kg in 2015. However, fresh pulses also experienced a drop, rather than an increase. The main reason for this is that fresh pulses lack the all-important convenience factor.
Carbs Struggle
Overall, the creators of the Eatwell Guide did quite an admirable job at trying to take current U.K. eating trends into account while, at the same time, advocating a healthy diet. Of course, there will always be sticking points, like in the case of butter, where public perception runs counter to nutrition science.
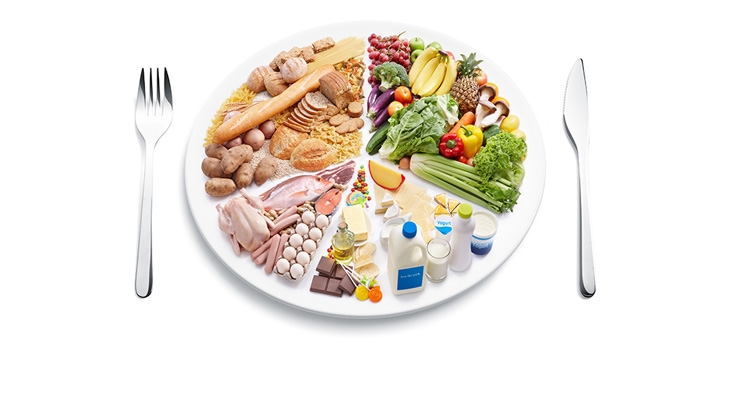
Carbohydrates are another one of these issues. The Eatwell Guide's advice to "base meals around starchy carbohydrate foods" is a message that is falling out of favor with consumers, because carbs have come to be regarded as "fattening." According to our packaged food data, sales of all the principal carbohydrate sources cited on the stylized plate graphic, namely potatoes, bread, rice and pasta, are struggling in the U.K.
Total fresh potato volumes, for instance, plummeted from 40.3 kg per capita in 2010 to 34.0 kg in 2015, and those of bread fell from 41.4 kg to 35.5 kg in the same period. Rice, pasta and noodles managed to cling on, posting a marginal increase 0.3 kg per capita increase since 2010—nowhere near enough to compensate for the losses experienced by the other staple carbohydrate categories. Unfortunately, it isn't fresh produce that is benefiting from this; our fresh food data show that per capita volume sales of fresh fruits and vegetables fell by 4% during 2010-2015.
Today's consumers are instead looking for protein-rich foods to compensate for maligned carbs. Fresh eggs managed to take advantage of this trend, gaining 13% in per capita volumes over the review period. Fresh pulses, however, didn't, as already pointed out, with per capita volumes declining by 5% over the review period. It seems that consumers are more drawn to processed, packaged, high-protein options, such as snack foods made from pulses and, increasingly, dried meat which is, after all, what one would expect in a heavily convenience-oriented market like the U.K.
For further insight contact Ewa Hudson, Global Head of Health and Wellness Research at Euromonitor International, at ewa.hudson@euromonitor.com; http://blog.euromonitor.com